|
By
far the most sophisticated resolution criterion for the objective evaluation
of an optical system is the polychromatic Modulation Transfer Function (MTF).
The
MTF is a quantitative measure of the effectiveness of an optical
system (lens or lens system) to recreate the contrast detail in a
scene. Mathematically, the MTF is the magnitude of the complex
Optical Transfer Function. Before the development of MTF techniques (in the 1950s), the
subjective evaluation of an optical system by viewing a
resolution chart (bar patterns of varying pitch) had proven
unreliable and lacking consistency. Between different observers,
variations of 20 - 30% were not unusual. Further, the use
of single - value performance measures (resolving power, classical Strehl
ratio, ...) to predict image quality was imprecise.
Understand that MTF and image quality
are not one and the same. Image quality is dependent on the information transfer (to recreate the contrast detail)
from object to image, the effect of noise on the perceptual process
and psychophysical factors, (inherent characteristics of the
human visual system). The optical system is just one component
of an 'imaging chain' that includes human vision.
Today, most optical designs can benefit from automatic optimisation
programs to control the aberration balance, the manufacturing
tolerances and thereby maximise the performance. Modern lenses
are engineered to offer high performance (and build quality) using aspherical
elements and glasses that reduce
chromatic effects.
Nearly all optics
manufacturers publish abridged MTF data (though
optical and mechanical tolerances can be specified, the
computed MTF is for a typical lens)
for
their
range of commercial products. Moreover, the MTF data are wavelength
dependent, the spectral quality of the light must be
characterised. MTF performance that is limited by
diffraction alone is referred to as diffraction - limited and cannot
be exceeded. Bear in mind, diffraction is a fundamental property of wave
propagation (that is always present), the deleterious effects are unavoidable.
Think of diffraction - limited performance as the benchmark for performance excellence.
Real
lenses are non - diffraction - limited, residual (primary and
higher - order) aberrations (distortion
of the wavefront from an ideal spherical shape that is predicted by
geometrical optics) and defocus
degrade the
MTF performance.
The MTF
of a photographic lens may be presented in various guises,
ultimately this 'quality criterion' must
be related to the actual behaviour of the lens. A typical MTF representation is
the modulation transfer (modulationimage/modulationobject)
as a function of the spatial frequency, at various field angles,
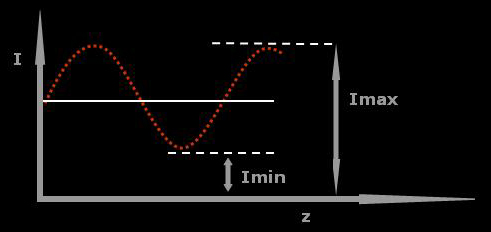
for example, 0° (on - axis), 10°, 40°, ... . Modulation is essentially contrast
(the relative difference between light and dark features) that is
defined in a particular way. A sinusoidal object produces a
sinusoidal image with reduced contrast. The contrast (C) for a sine
wave pattern is
illustrated. Other patterns (bar patterns (square wave response)
and real scenes) may be decomposed into a set of
harmonically related sine waves using the techniques of Fourier
analysis (after J Fourier, 1768 - 1830).
|
C
= (Imax
− Imin) /(Imax + Imin) |
The
spatial
frequency, the rate of change of brightness from dark to light (that
corresponds to one bar and one space of a resolution
chart) is measured in line pairs per millimetre (lp/mm), low lp/mm
relate to coarse detail, high lp/mm relate to fine detail. The MTF
characterises the transfer of contrast (from object to image) as a
function of the spatial frequency. That is to say, the spatial
frequency of the object (scene) structure. Lower spatial frequencies
are transferred at a higher contrast, on a resolution chart the black and
white bars
are
separated, higher spatial frequencies are transferred at a
lower contrast, on a resolution chart
the black and white bars are
merged. Notice the inverse relationship between contrast
and spatial frequency.
Fine detail is degraded more than coarse detail. By convention, the MTF is normalised to unity
(1 is 100% modulation transfer) at zero spatial frequency.
Off - axis,
the sagittal (or radial) MTF and tangential (or meridional) MTF are recorded
independently.
To gain an appreciation, consider the object (subject) to be a spoked wheel that is
placed
perpendicular to
the optical axis, the sagittal MTFs relate to lines parallel to the
radii (the spokes),
the tangential MTFs relate to lines perpendicular to the radii (the
rim).
On paper, all of the aberrations are correctable and the MTF can approach
the diffraction limit from below. A real world lens has an
MTF close to unity (100%) at low spatial frequencies, gradually
falling with increasing spatial frequency.
As the field angle increases there is a marked deterioration of the MTF.
To
demonstrate trends, the MTF is plotted as a function of the normalised spatial frequency
f/fc,
where f is the absolute spatial frequency.
Several points are noteworthy:
-
the
blue curve shows the diffraction - limited performance, notice
that for lower spatial frequencies the
curve is almost a straight line.
-
the
green curves show two lenses with the same diffraction cutoff
frequency, the dashed curve is for a lens that has good contrast
transfer at low frequencies,
the solid curve is for a lens that
has good contrast transfer at high frequencies and superior
detail rendition. Bear in mind, the effect of contrast on the
subjective impression of image quality is dependent on the noise
in the image.
-
manual focusing (particularly at close focus distances) must be
accurate, focus error can induce a significant modulation
reduction and a loss of image quality.
For a linear defocus
z, the diameter of the corresponding blur circle is
z/f/#.
The
red curve shows the MTF for a defocused lens, reproduced from MATHCAD
worksheets. The defocus is described by a
dimensionless parameter Δ, where
Δ = 1/2(f/#)2 z/λ. Notice how the MTF
falls and goes negative (below zero), the effect is a contrast
(black and white) reversal, termed spurious resolution.
You can see that a lens functions as a low pass filter of the scene
detail. The spatial spectrum is attenuated selectively, slightly blurring the image
(without aberrations and diffraction there would be no blurring, the MTF would be unity at all spatial
frequencies). The relevance of low - pass filtering can be
easily demonstrated by a familiar example, consider a uniform scene, rolling hills that
are crossed by the cables
of
electricity pylons,
low - pass filtering would attenuate the high
frequency components, the cables, and leave the low frequency components,
the rolling hills, relatively unchanged.
The diffraction cutoff frequency (fc)
is given by
1/λf/#,
where the MTF approaches zero. At spatial frequencies above the
diffraction cutoff frequency,
the scene
detail is removed.
The table lists the dependence on f - number (f/#),
for light at the
centre wavelength (λ = 0.555 μm) of the visible spectrum.
|
f/# |
Cut - Off (lp/mm) |
|
2.8 |
644 |
|
5.6 |
322 |
|
11 |
164 |
|
22 |
82 |
These are very high frequencies compared to the cutoff frequency of
the human eye.
For a photopic pupil diameter of about 2 mm, the performance of the
human eye
is
near diffraction - limited. Of course, this does not take account of
any retinal limitations. If you have 20/20 vision (the human eye
can resolve
about one minute
of arc), at the distance of most
distinct vision, the resolving power
corresponds to a spatial
frequency of about 7 lp/mm. Projected onto the image plane, about
60 lp/mm for the 35 mm format. If you have 20/10 vision (under ideal conditions the human eye can
resolve about thirty seconds of arc), at the distance of most distinct vision, the resolving power corresponds to
a spatial frequency of about
14 lp/mm. Over all age groups,
the average visual acuity is somewhere between. Further, for dark lines on a
light background and for light lines on a dark background, the
perception of detail is different.
On a resolution chart, one line
pair is one (black) bar and one (white) space.
Even though all camera components (lens, film/image sensor,
electronic processor, ...) effect the ability to resolve detail, the human eye is the limiting
element.
An
alternative MTF representation is
the modulation transfer
as a
function of the image diagonal (measured from the optical axis) at
different spatial frequencies,
for example, 10, 20,
40, ... lp/mm. The top to bottom curves relate to the lowest to
highest spatial frequencies. Recall that the MTF decreases as the spatial
frequency (lp/mm) increases.
Most MTF data provided by optics manufacturers are charted like so, from the centre to the edge of the image.
For the 35 mm (film) and full frame (digital) format the semi - diagonal
dimension is 21.65 mm,
for the sub full frame (digital) formats the semi - diagonal
dimension varies, (APS - H)
17.25 mm, (Nikon DX) 14.20 mm, (APS - C) 13.35 mm,
(Four Thirds) 10.80 mm, ... .
Lenses that are designed exclusively for digital cameras
have image circles that
are matched to the image sensor format to
guarantee centre to edge image quality.
To
demonstrate trends, the MTF (for a 35 mm format lens) is plotted as
a function of the image diagonal.
Several points are noteworthy:
-
at f/11, there are no specific aberrations (closing the lens
reduces the residual aberrations),
across the image circle the contrast transfer of low spatial frequency
detail (10 lp/mm) is constant and close to unity (100%).
-
at f/2.8 there are uncorrected aberrations,
across the image circle the contrast transfer of low spatial frequency
detail
(10 lp/mm) though relatively high is variable, at the edge of
the image the MTF degrades rapidly.
-
at f/11, there are no specific aberrations (closing the lens
reduces the residual aberrations) but the effects of
diffraction are more evident,
across the image circle the contrast transfer of
higher spatial frequency
detail (40 lp/mm) is constant (but depressed from the
10 lp/mm
curve), at the edge of the image
the MTF degrades rapidly.
Mounted on a sub full frame DSLR body,
the lens is capable of excellent sharpness from the centre to
the edge of the image.
In practice, the MTF is not measured at discrete spatial frequencies
but automatically over a continuum of spatial frequencies, at
various field angles, using an instrument that can present an edge
or line intensity distribution to the lens under test (there are
many techniques based on the ISO 12233 and 15529
standards). The captured image (edge or line spread function) is
sampled and processed by software that uses a mathematical procedure
called Fourier transformation to compute the sine wave spatial frequency response.
One final point, imaging a bar pattern produces the square wave
spatial frequency response or Contrast Transfer Function (CTF).
By Fourier analysis, the MTF can be derived from the CTF (MTF = π/4[Σ CTF]).
To assess the global performance of a lens, you must inspect a family of MTF curves
that are (computed or measured) at different aperture and
focus distance settings.
Some manufacturers provide only computed (nominal) MTF curves
at infinity and
close focus distances. Even with meticulous quality control
procedures, the computed MTF data may not characterise the true performance of the
production lens, due to manufacturing and (assembly) defects.
What to look for on an MTF chart -
-
The
closer to unity (at full aperture, above 80%) the 10 lp/mm curve on the chart, the higher the
contrast quality in the image. Curves
should be even,
from the centre to the edge of the image.
-
The closer to unity
(at full aperture, above 40%) the 40 lp/mm curve on the chart, the higher the
resolution quality and perceived sharpness in
the image. Curves should be even, from the centre to the edge of the
image.
-
Throughout the aperture range (lens closed and open),
from the centre to the edge of the image, the MTF curves should
not be widely separated. Most 35 mm lenses provide their best
performance (sharpness) at about f/8 - f/11.
Further,
the sagittal and
tangential MTF curves should more or less coincide, divergent MTF
curves may indicate uncorrected
off - axis aberrations (astigmatism,
coma, ...) and transverse chromatic aberration. The former can be
reduced by closing the lens, provided that diffraction blur is not
evident.
In general, for the higher priced lenses
(chromatically corrected), the MTF curves are less separated.
Learn how to interpret MTF charts, the concepts are not
difficult to grasp.
To compare different
manufacturers products, always check the scaling of the MTF chart
and the particular test conditions. Compare products side - by - side (the same aperture and focal length) and relate the MTF
data to actual conditions, your proposed use of the lens, for
example, general
purpose or specialised photography (action, landscape, wildlife,
...). The MTF chart can help you to evaluate lens performance
(to identify limitations) and to form an opinion on value for money
(you are probably purchasing on a budget).
For a balanced appraisal, the MTF charts should be read with
accompanying lens performance data (distortion, flare, ...). Above
all, look for performance excellence at apertures and focal lengths
that are best suited to your photographic technique
and range of subject matter. Finally, read photographic magazines
and browse manufacturers websites, their product reviews (test results) may
provide useful advice.
The application of MTF techniques to evaluate optical systems is
analogous to
the impulse response techniques (that uses a mathematical
procedure called Laplace transformation) to evaluate electronic
systems. In fact, each camera component has an associated MTF, lens, film/image sensor,
electronic processor and integral colour LCD viewing screen, where the camera MTF is the product of the component MTFs.
MTF analysis is part of the rigorous treatment that
camera and optics manufacturers use to predict product performance.
The application of the MTF methodology to photographic systems
is reviewed in a forthcoming book.
In conclusion, the Modulation Transfer Function
(MTF) is an objective measure of performance that is reproducible
(the MTF can be computed
and measured)
and correlates with our subjective image quality evaluation.
| All
images and text © imajtrek
|
|